Newly Organized Workers Drop 38% in 2025. What the Numbers Really Say About Union Organizing. Report available for purchase here.
If you only look at win rates, 2025 looks like another strong year for organized labor.
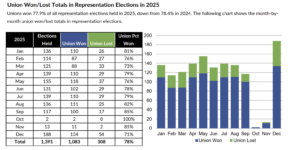
Unions won 78 percent of representation elections, exactly in line with 2023 and 2024. That number is easy to cite. It fits comfortably inside the broader narrative of sustained labor momentum. And on its own, it sounds convincing.
But when you step back and look at what those wins actually produced, a different story emerges.
The Headline Number That Matters
In 2025, unions organized 66,137 workers through representation elections.
Total Workers Organized Collapsed (See chart below)
Union win rates held steady in 2025. The number of workers actually organized did not.
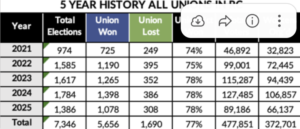
That is a 38 percent decline from 2024, when unions organized 106,857 workers. It is also lower than 2022, despite higher union win rates in 2025.
This is not a marginal dip. It is a sharp break from the trajectory of the past several years.
From 2021 through 2024, organizing expanded steadily and dramatically. The number of workers organized through NLRB elections more than tripled during that period, rising from roughly 33,000 to more than 106,000. Total voters increased every year. Election volume increased every year. The system was adding both activity and scale.
Then 2025 arrived, and the bottom fell out of the headcount.
Election volume declined, but not nearly enough to explain the drop in workers organized. Representation elections were down 22 percent year over year. Total voters were down 30 percent. But workers organized fell by nearly 40 percent.
That gap is the story.
Same Win Rate, Lower Yield
Nothing in the data suggests unions suddenly became worse at winning elections.
They did not.
The union win rate held steady at 78 percent. Month by month, the win-loss pattern in representation elections looks familiar. There is no collapse in performance. There is no surge in employer victories.
Stable Win Rates
This was not a year of rising employer victories. The drop in impact came from somewhere else.
What changed was the yield.
The average number of workers organized per union win fell by roughly 20 percent year over year. Unions won just as often, but each victory delivered fewer people. Wins accumulated. Impact did not.
If you are tracking labor momentum solely by election outcomes, 2025 looks stable. If you are tracking it by the number of workers actually added to bargaining units, 2025 looks fundamentally different.
Small Units Are Doing Most of the Work
The explanation for this disconnect is not mysterious. It is structural.
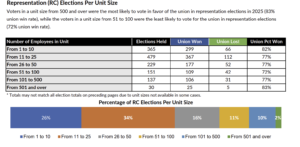
In 2025, 34 percent of all representation elections involved bargaining units of 11 to 25 employees, the largest single category. Fully 60 percent of elections involved units of 25 employees or fewer. Only 2 percent of elections involved units with 500 or more employees.
Unit Size Distribution (See chart below)
Most union wins in 2025 came from small units. High success rates, limited scale.
That unit-size distribution explains nearly everything else in the data.
Smaller units mean fewer voters. Fewer voters mean fewer workers organized, even when unions win at high rates. The system can stay busy while producing far less aggregate impact.
Organizing in 2025 was not about scale. It was about volume.
Industry Concentration
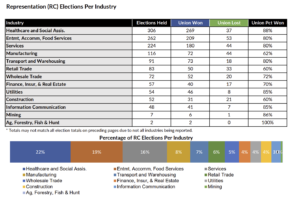
Healthcare drove election volume and win rates in 2025, masking softer results elsewhere.
Healthcare Is Carrying the Averages
Healthcare and social assistance dominated representation election activity in 2025.
There were 306 healthcare representation elections, more than any other industry by a wide margin. Unions won 88 percent of those elections, one of the highest success rates in the dataset. Healthcare alone accounted for 22 percent of all representation elections.
Unions with strong healthcare portfolios, including the Steelworkers and healthcare-focused affiliates, performed exceptionally well in this space. That success matters, but it also distorts the overall picture.
Outside healthcare, win rates were lower and outcomes more mixed. The strong healthcare numbers help prop up the aggregate success rate, even as organizing elsewhere delivers smaller, more fragmented gains.
We will further address these healthcare organizing trends in a future article.
Not All Unions Are Winning the Same Way
Looking across individual unions makes the pattern clearer.
Several highly active unions ran numerous campaigns in 2025 but posted lower win rates than healthcare-centric unions. The UAW, UFCW, and Plumbers and Pipe Fitters were all active, but activity did not translate into dominance.
The gap between being most active and being most effective widened. That gap matters when the total organizing yield is already shrinking.
Employer-Filed Activity Keeps Falling
Another quiet trend continued in 2025.
Employer-filed elections fell 50 percent. Employer-filed petitions fell 52 percent. The number of workers organized through employer-filed elections dropped 66 percent.
Whatever employers are choosing to do in response to organizing pressure, it increasingly does not involve triggering RM elections.
Decertification Slowed, But Losses Continue
Decertification elections declined by 24 percent in 2025, and unions performed better in those elections than in 2024, winning 44 percent of the time.
Still, unions lost 2,292 workers through decertification elections. Successful decertifications tended to involve larger units, while smaller units were more likely to remain certified.
Election Wins Still Don’t Translate To Union Contract Wins
Legacy bargaining units are eroding slowly rather than collapsing. Whether that changes in the future may depend on unresolved contract stagnation at high-profile employers. Starbucks is the obvious example. After four years without a first contract in many locations, it would not be surprising to see increased decertification pressure emerge over time.
What 2025 Actually Represents
From 2021 through 2024, union organizing expanded in both volume and scale.
In 2025, the system stayed busy. Win rates stayed high. But the organizing footprint shrank materially.
That makes 2025 neither a surge nor a collapse. It is a structural shift.
Organizing moved:
- from large units to small ones,
- from headcount growth to election count growth,
- from scale to fragmentation.
Those distinctions matter, especially for employers, policymakers, and analysts trying to understand what union momentum actually looks like on the ground.
In 2025, the wins stayed high. The impact did not.
You can purchase the LRIrightnow Elections Review 2025 for only $225 by clicking here.