
Every year, the U.S. Bureau of Labor Statistics releases its annual Union Members report. Predictably, unions always point toward choice figures as evidence to fuel organizing campaigns. Of course, that’s never the whole story. BLS states as much.
In this year’s report, one statement of interest is as follows: “Among full-time wage and salary workers, union members had median usual weekly earnings of $1,404 in 2025, while nonunion workers had median usual weekly earnings of $1,174.”
Here’s the BLS disclaimer that also points toward illustrative tables: “The comparisons of earnings in this news release are on a broad level and do not control for many factors that can be important in explaining earnings differences.”
The BLS is warning against apples-to-oranges comparisons. The data in Table 2 shows how workers’ age, sex, and race are contributing factors in earnings differences, whereas Table 4 focuses on industry. Specifically, we’ll discuss industry comparisons in this article (as our own Phil Wilson did a few years ago while discussing manufacturing workers’ wages in relation to a myth spread by UAW organizers).
To be clear, no “union premium” or “advantage” exists on wages between non-union workers and union members. In fact, the contrary can be argued for this BLS data broken down by sector and occupation instead of using aggregates that explain nothing or, worse, mislead workers.
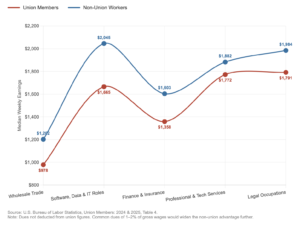
1. Wholesale Trade: Union wages collapsed while non-union wages surged
Year over year, union member wages in Wholesale Trade dropped from $1,158 in 2024 to $978 in 2025. That’s a $180 per week decline. However, non-union wages moved in the opposite direction, reaching $1,202. That’s a $224 per week non-union advantage in distribution for food and beverage, pharmaceutical and medical, consumer goods, building materials, and electronics.
2. Software, Data and IT Roles: Non-union workers earn $380 per week more
In Computer and Mathematical occupations, non-union workers earn $2,045 per week versus $1,665 for union members. In a separate report, the bureau projected this to be one of the fastest growing employment fields through 2034, so of course unions will target these workers without admitting that workers would likely fare better without their representation.
3. Finance and Professional Services: Non-union workers lead in every subcategory
The pattern is clear in non-union over union workers including Finance and Insurance with $1,603 vs. $1,358 and Professional and Technical Services with $1,882 vs. $1,772.
4. Legal Occupations: Non-union workers earn around $10,000 more per year
Non-union legal workers earn $1,984 per week versus $1,791 for union members. This $193 weekly gap adds up to $10,036 per year and spans roles from attorneys to paralegals and legal support staff.
5. In sectors that appear close, the math on dues isn’t pretty:
– In Retail Trade, union members earn $908 versus $913 for non-union workers. Monthly union dues deductions widen that gap even more.
– In Telecommunications, non-union wages of $1,512 already exceed union wages of $1,431 before dues, and the gap grows larger when dues hit.
– And in Manufacturing, the story is slightly changed this year. Union members earn $1,340, versus $1,237 for non-union workers, but dues of 1-2% of gross wages reduce that $103 gap by nearly half before any other factor is considered.
Conclusion: Union membership doesn’t pay for anybody but unions
When you look past media headlines and union rhetoric, the same government data unions use in organizing campaigns tells a more complete story. Non-union workers across several industries and occupations consistently come out ahead. For employers, that’s a government-sourced response to one of the most common claims your workers will hear from organizers.